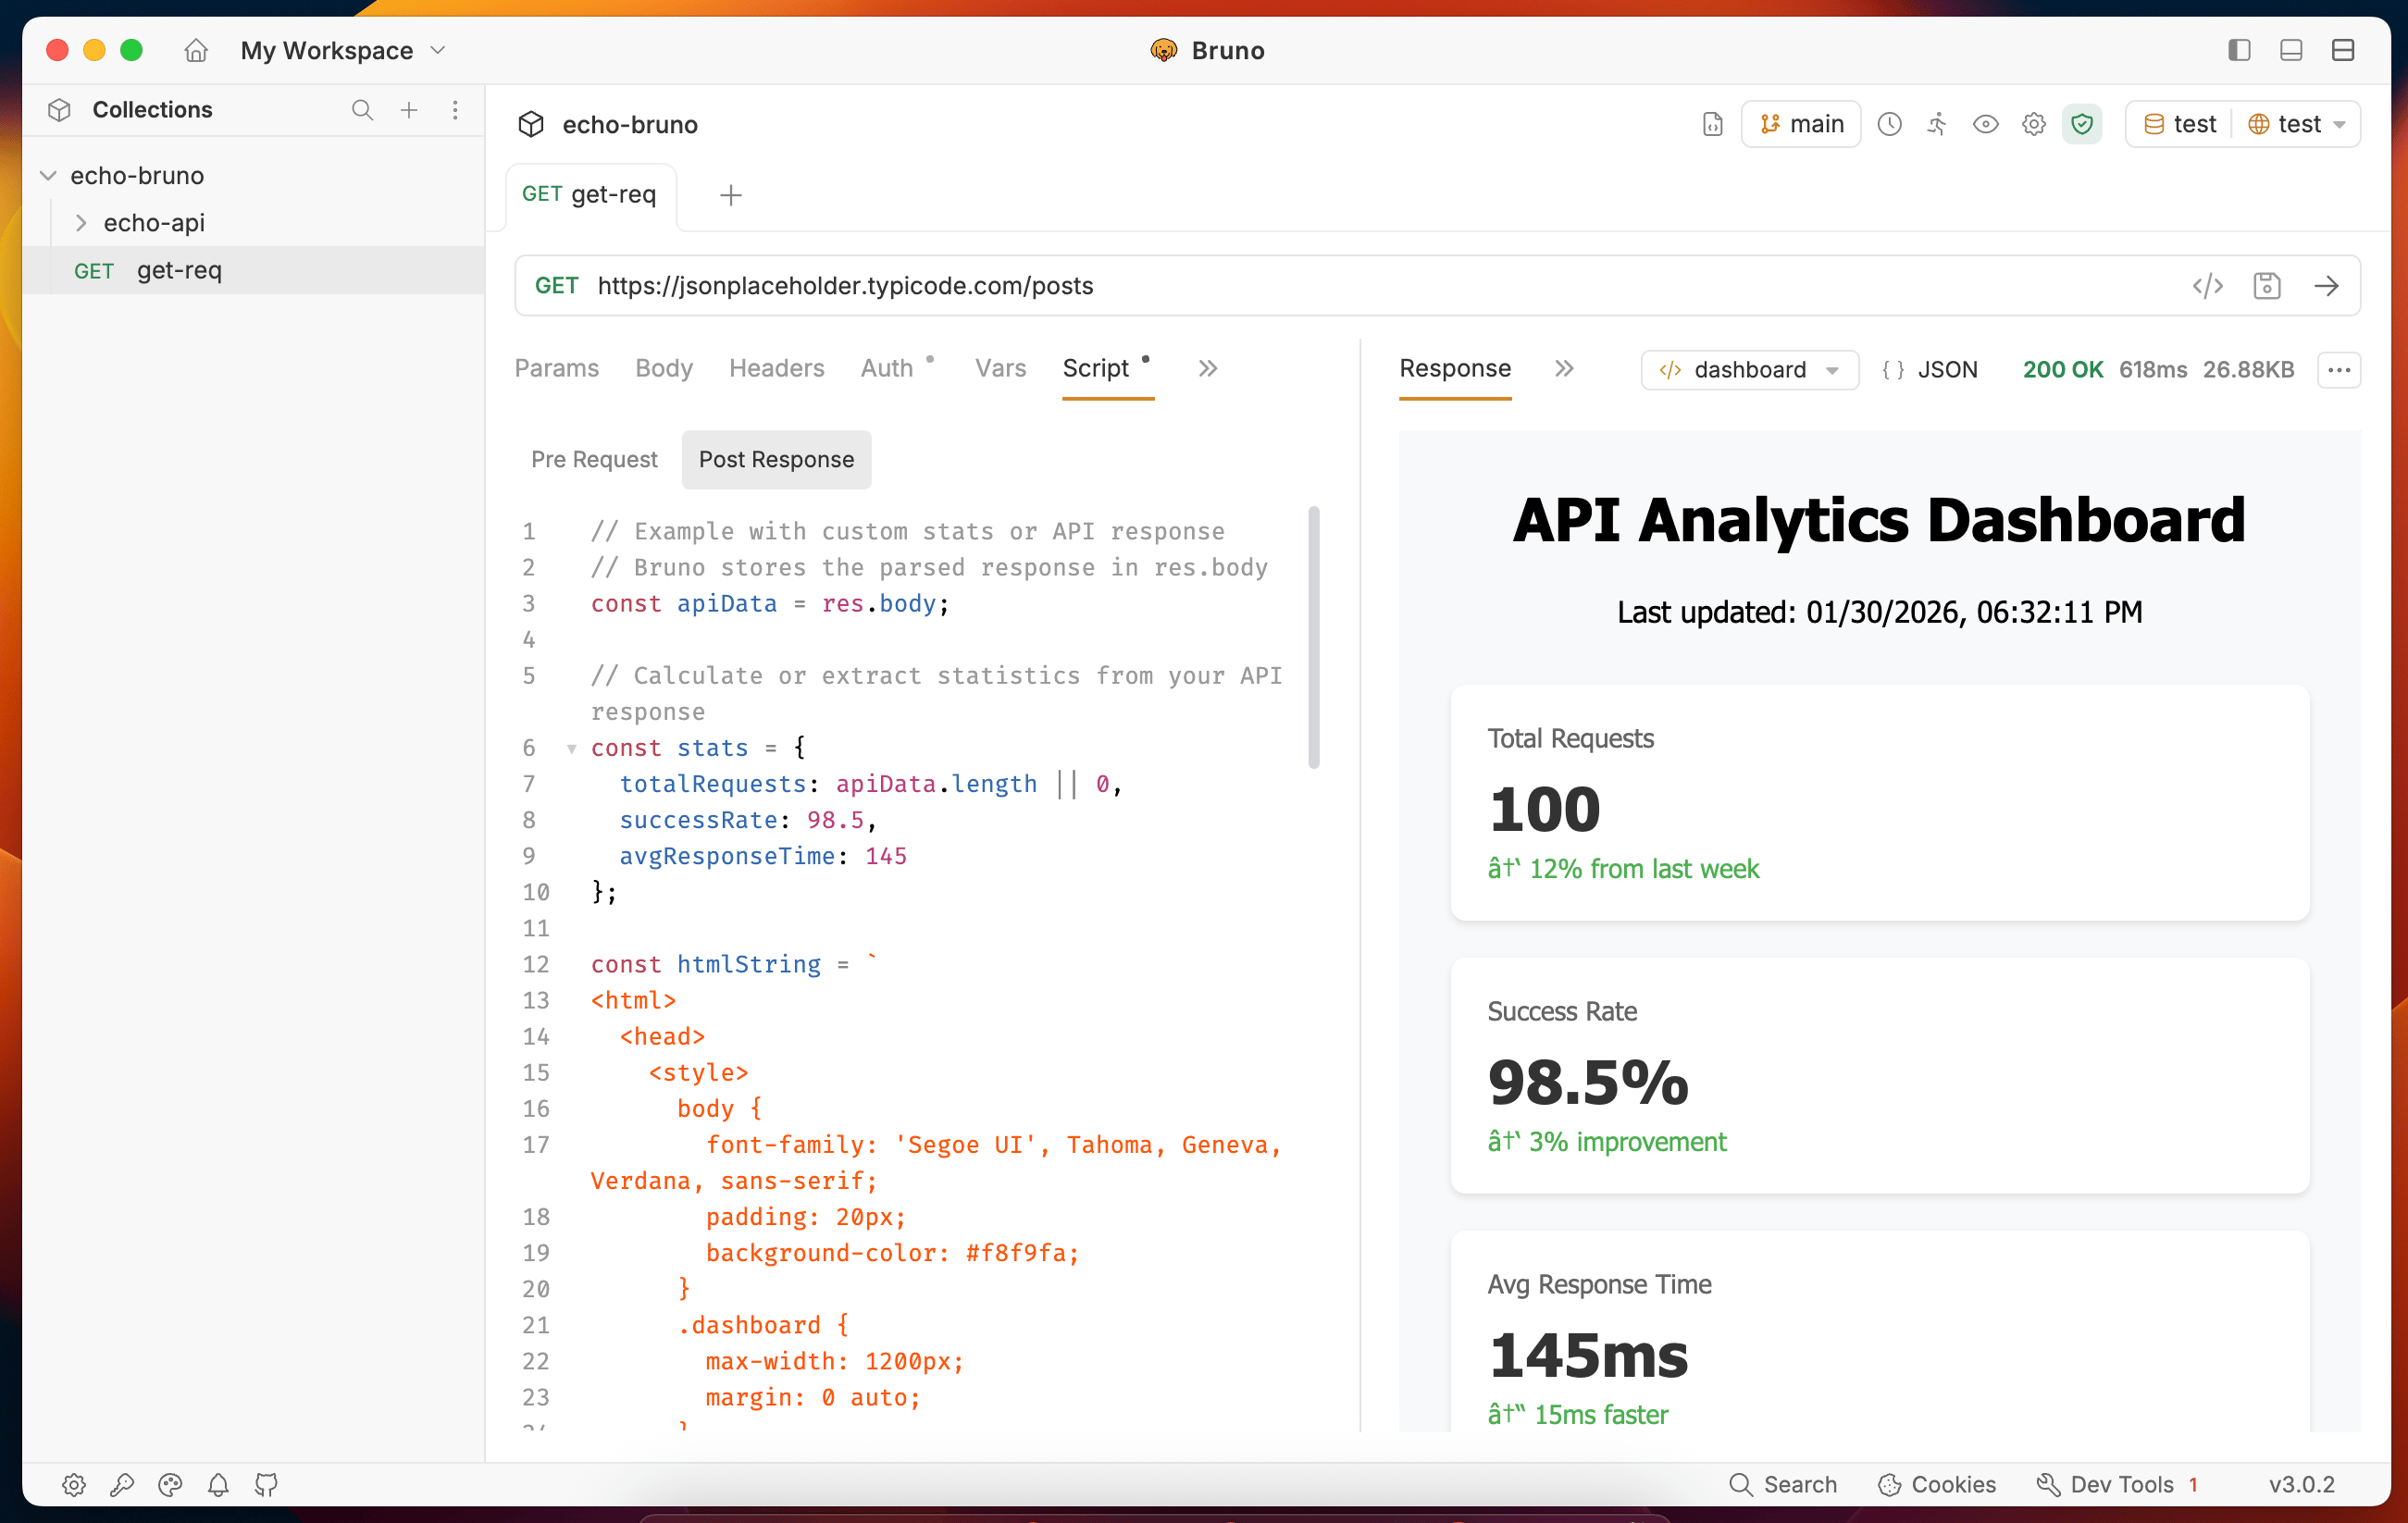
bru.visualize function. This feature supports multiple providers and formats to help you analyze and present your API data effectively.
- type(string): The type of visualization to render (e.g., ‘table’, ‘html’).
-
config(object): Depends on
type:table: name, provider (ag-grid,react-table), props.html(raw HTML): name, content — unchanged from earlier releases.html(Handlebars): name, template (Handlebars string), data (object passed into the template), optional options.
Supported Visualization Types and Providers
Table Visualization (‘table’)
You can render tables using different providers likeag-grid and react-table.
Using ag-grid
Example: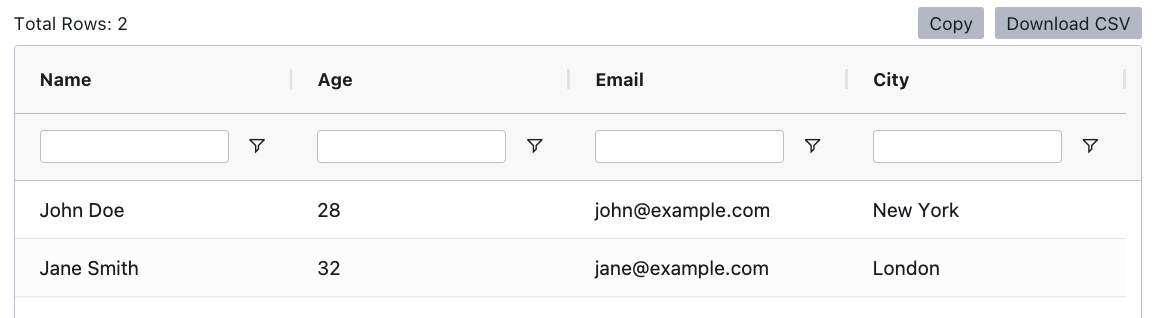
copy
Using react-table
Example: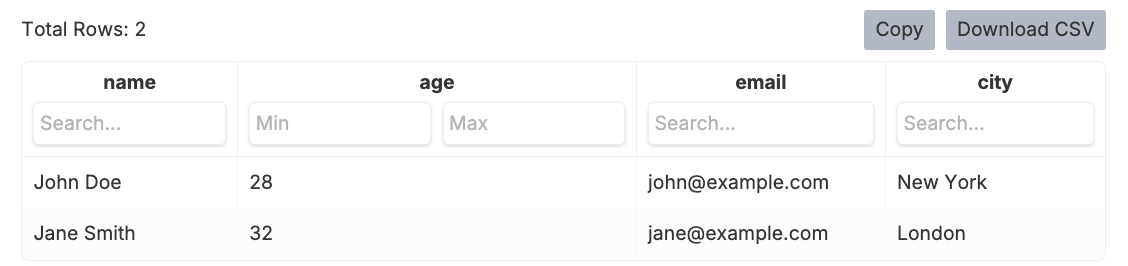
copy
The
header property only accepts string values. Use strings like header: "Column Name".HTML visualization ('html')
You can render either raw HTML (existing behavior) or a Handlebars template with structured data.
Raw HTML (content)
Pass a full HTML string. This mode works in QuickJS safe mode and behaves as before.
Example:

copy
Handlebars template (template, data, options)
Use Handlebars when you want a small template plus JSON data instead of building HTML strings in script:
copy
rawData is passed alongside rendered HTML.
bru.clearVisualizations()
Clears every visualization registered for the current request and resets the internal list (same idea as Postman’s pm.visualizer.clear()).
copy
Postman pm.visualizer mapping
When you import a Postman collection, script calls are translated automatically:
Export from Bruno back to Postman performs the inverse mapping for the same patterns. Table visualizations (ag-grid, react-table) and raw
content HTML are unchanged by this translation.
Import/export translation is covered by the collection converters; see Postman migration and Converters overview.
Using API Response Data
One of the most powerful features ofbru.visualize is the ability to transform API responses into visual tables. Here are practical examples of working with real API data:
In Bruno, the parsed API response is stored in res.body
Example 1: Simple User List API
For an API that returns a list of users:copy
Example 2: Nested API Response Data
For APIs returning nested objects, you can flatten the data before visualization:copy
Example 3: Transforming Complex Data
For complex responses that need transformation before visualization:copy
Example 4: Error Handling with API Data
Always include error handling when working with API responses:copy
- Always verify the response structure before accessing nested properties
- Use optional chaining (
?.) to safely access nested data - Transform data to match your visualization needs
- Add meaningful column headers using the
fieldproperty - Enable filters for better data exploration
Using API Response Data with HTML
You can dynamically generate HTML from API responses:copy
Custom Dashboard with Statistics
Create rich dashboards with API data:copy
Viewing Your Visualization
- Add the visualization code to your request’s script section
- Execute the request
- Your visualization will be displayed in the panel